Some statistics on Pickles government vehicle auctions
I collected information on sales at three Pickles ‘Victorian Government & Council Vehicles’ auctions on 13, 20 and 27 August 2019. I collected data on ‘personal vehicles’, which I defined as vehicles with a sedan, wagon, hatchback or liftback body type. I compared winning bids with estimated prices for equivalent vehicles from the RACQ car valuation website.
The collected data totals 241 personal vehicles across the 3 auctions.
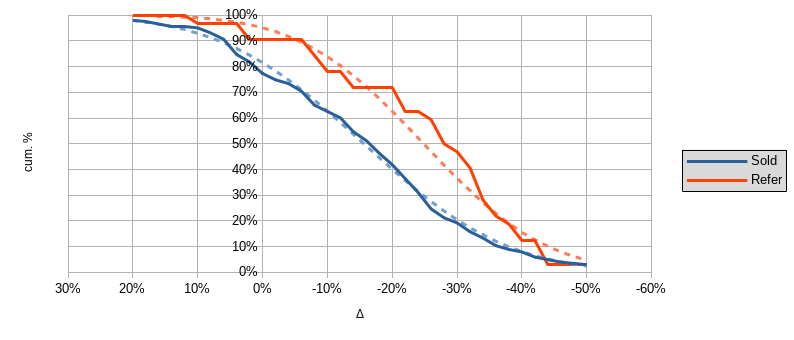
The graph below shows the cumulative distribution of the percentage difference between the winning bid and RACQ market price, for bids that resulted in a sale, and for bids that resulted in a referral. The dotted lines show a fitted normal distribution:

77% of vehicles sold were sold at or below the RACQ market price. The median difference was approximately −17%, i.e. vehicles were sold at a median of 17% below the RACQ market price.
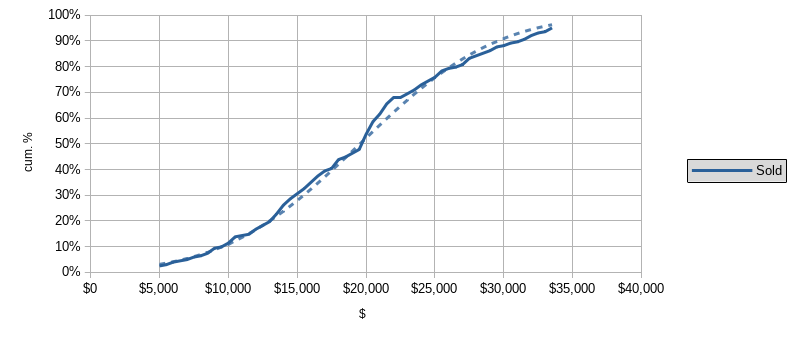
The graph below shows the cumulative distribution of winning bids that resulted in a sale:

11% of vehicles were sold at or below $10,000. The median sale price was approximately $20,000.
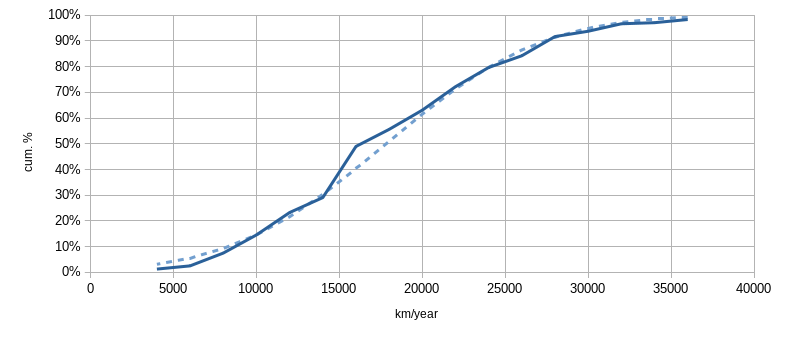
The graph below shows the cumulative distribution of kilometres travelled per year since the year of purchase:

The median was approximately 16,500 kilometres travelled per year.
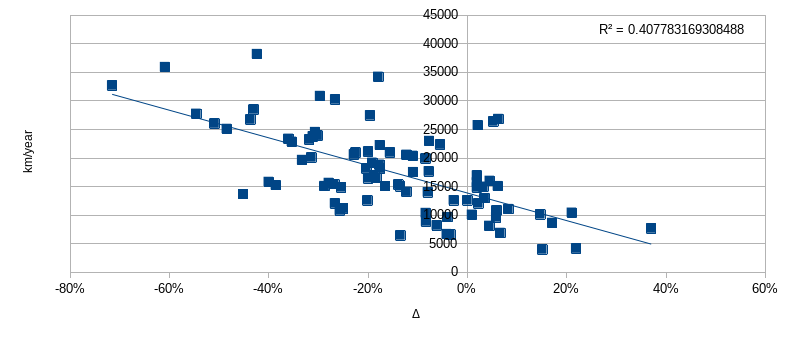
The final graph shows a plot of percentage difference against kilometres per year for bids that resulted in a sale:

There was a moderate negative correlation between kilometres per year and percentage difference. No personal vehicle with more than approximately 27,000 kilometres per year sold for more than the RACQ market price, and no vehicle with fewer than 5,000 kilometres per year sold for less than the RACQ market price.
For more detailed history, Pickles provides detailed price history by subscription through its online website Prices People Pay.