Australian English communication growth charts
Warning! The intended audience of this article is medical professionals and students. I am not your doctor. This article is not medical advice. This article has not been subject to formal peer review.
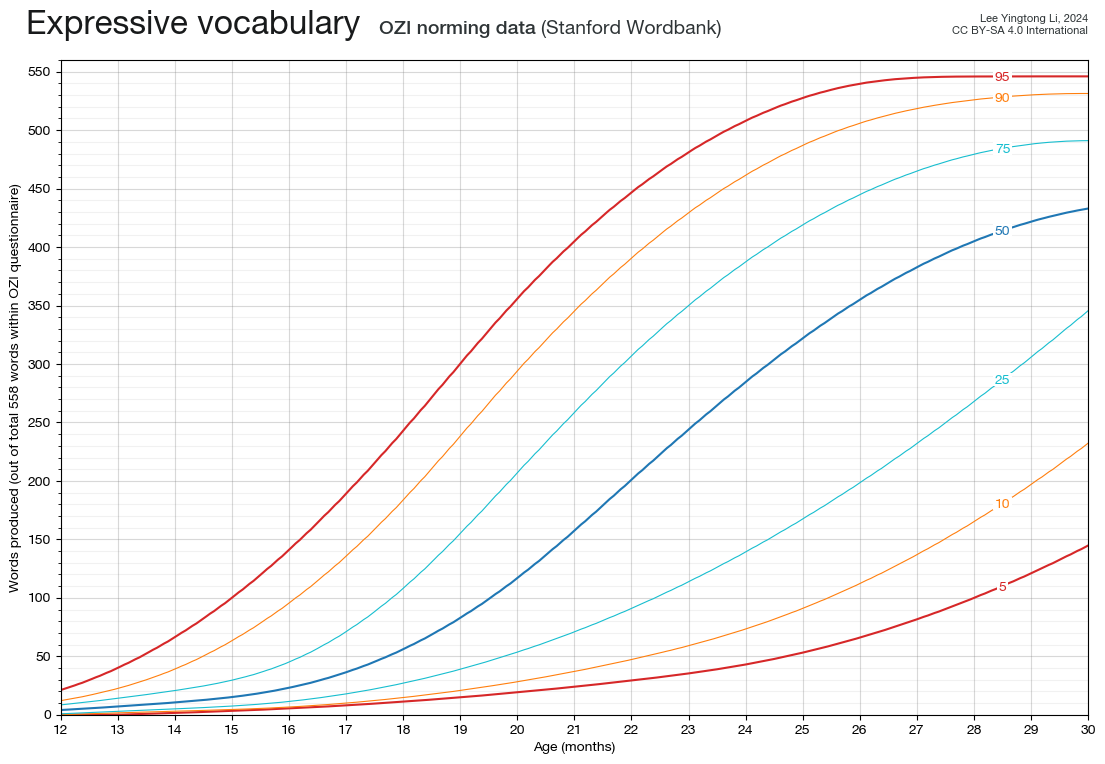
Below are presented expressive vocabulary ‘growth charts’ and limit ages, for an Australian English cohort, based on the norming samples for the long-form Australian English Communicative Development Inventory (OZI),1,2 and its short form (OZI-SF).3,4
| Estimated age (months) achieved by proportion | ||||
|---|---|---|---|---|
| Words produced | 50% | 75% | 90% | 95% |
| 2 | 12.0 | 12.6 | 13.3 | 14.3 |
| 6 | 12.7 | 14.5 | 15.8 | 16.3 |
| 8 | 13.3 | 15.2 | 16.5 | 17.0 |
| 15 | 15.0 | 16.6 | 18.1 | 19.0 |
| 50 | 17.7 | 19.8 | 22.3 | 24.7 |
| Estimated age (months) achieved by proportion | |||||
|---|---|---|---|---|---|
| Combines 2 words | 50% | 75% | 90% | 95% | 97% |
| Sometimes or often | 18.8 | 22.1 | 25.4 | 27.6 | 29.2 |
| Often | 24.0 | 27.1 | 30.2* | 32.3* | 33.8* |
*Extrapolation beyond 30 months
Methods
For the data on expressive vocabulary, data on the norming sample for the OZI were extracted from Stanford Wordbank5,6 (licensed under the CC BY 4.0 International licence), yielding data for 1496 children aged between 12 and 30 months. Nonparametric monotonic quantile regression was performed using the quantregGrowth R package.7,9 The growth curves and limit ages shown are based on the regression fitted quantile lines.
For the data on combining words, data on the norming sample for the OZI-SF were obtained from the Western Sydney University research data repository10 (licensed under the CC BY 4.0 International licence), yielding data for 230 children aged between approximately 12 and 30 months. Semiparametric binomial GAMLSS regression was performed using the gamlss R package.11,12 A regression model was fitted for the proportion of children who ‘often’ combined 2 words (compared with those who combined words ‘sometimes’ or ‘not yet’), and a separate second model was fitted for the proportion who ‘sometimes’ or ‘often’ combined 2 words (compared with those who did ‘not yet’ combine words). Limit ages are shown for each regression model based on the fitted probability of combining words according to age.
Python scripts for generating the growth chart graphics were adapted from those previously published for generating height-for-age and weight-for-age charts.
Remarks
The underlying vocabulary data in these analyses are based on parent report, according to a structured questionnaire involving 558 predetermined words. The estimated size of expressive vocabulary will therefore tend to underestimate the true vocabulary size when children have learned additional words outside of those asked in the OZI questionnaire – that is, particularly at the higher quantiles of higher age ranges.
Both the OZI and OZI-SF obtained norming samples from a middle-class socioeconomic demographic in metropolitan Sydney. These norms must therefore be applied with caution in different demographic settings.
References
- Kalashnikova M, Schwarz IC, Burnham D. OZI: Australian English Communicative Development Inventory. First Lang. 2016;36(4):407–27. doi: 10.1177/0142723716648846
- Infant vocabulary checklist (OZI-LF). Sydney: Western Sydney University; c2024 [cited 2024 Sep 8]. https://www.westernsydney.edu.au/babylab/research/infant_vocabulary_checklist_OZI_LF
- Jones C, Kalashnikova M, Khamchuang C, Best CT, Bowcock E, Dwyer A, et al. A short-form version of the Australian English Communicative Development Inventory. Int J Speech-Lang Pathol. 2022;24(4):341–51. doi: 10.1080/17549507.2021.1981446
- Infant vocabulary checklist (OZI-SF). Sydney: Western Sydney University; c2024 [cited 2024 Sep 8]. https://westernsydney.edu.au/babylab/research/infant_vocabulary_checklist_OZI_SF
- Frank MC, Braginsky M, Yurovsky D, Marchman VA. Wordbank: an open repository for developmental vocabulary data. J Child Lang. 2016;44(3):677–94. doi: 10.1017/S0305000916000209
- Wordbank: an open database of children's vocabulary development. Stanford (CA): Stanford University; [cited 2024 Sep 8]. https://wordbank.stanford.edu/
- Muggeo VM, Sciandra M, Tomasello A, Calvo S. Estimating growth charts via nonparametric quantile regression: a practical framework with application in ecology. Environ Ecol Stat. 2013;20:519–31. doi: 10.1007/s10651-012-0232-1
- Muggeo VM, Torretta F, Eilers PH, Sciandra M, Attanasio M. Multiple smoothing parameters selection in additive regression quantiles. Stat Model. 2021;21(5):428–48. doi: 10.1177/1471082X20929802
- Muggeo VM. quantregGrowth: Non-crossing additive regression quantiles and non-parametric growth charts. Comprehensive R Archive Network (CRAN). 2024 [cited 2024 Sep 8]. https://cran.r-project.org/package=quantregGrowth
- Jones C, Kalashnikova M, Khamchuang C, Best C, Bowcock E, Dwyer A, et al. Norming data for the short form of the Australian English Communicative Development Inventory (OZI-SF), as at April 2020. Sydney: Western Sydney University; 2020 [cited 2024 Sep 8]. https://research-data.westernsydney.edu.au/published/e98dcef0519311ecb15399911543e199/
- Rigby RA, Stasinopoulos DM. Generalized additive models for location, scale and shape. J R Stat Soc Ser C Appl Stat. 2005;54(3):507–54. doi: 10.1111/j.1467-9876.2005.00510.x
- Stasinopoulos M, Rigby R, Voudouris V, Akantziliotou C, Enea M, Kiose D, Zeileis A. gamlss: Generalized additive models for location scale and shape. Comprehensive R Archive Network (CRAN). 2024 [cited 2024 Sep 8]. https://cran.r-project.org/package=gamlss